
SPSS for Advanced Analytics
SPSS was developed to do most major types of data analysis using SPSS. The software was originally created by three Stanford graduate students in the late 1960s. The acronym “SPSS” initially stood for “Statistical Package for the Social Sciences.” As SPSS expanded their package to address the hard sciences and business markets, the name changed to “Statistical Product and Service Solutions.” In 2009 IBM purchased SPSS and the name morphed to “IBM SPSS Statistics.” SPSS is now such a standard in the industry that IBM has retained the name due to its recognizability. No one particularly cares what the letters “SPSS” stand for any longer. IBM SPSS Statistics is simply one of the world’s largest and most successful statistical software companies.
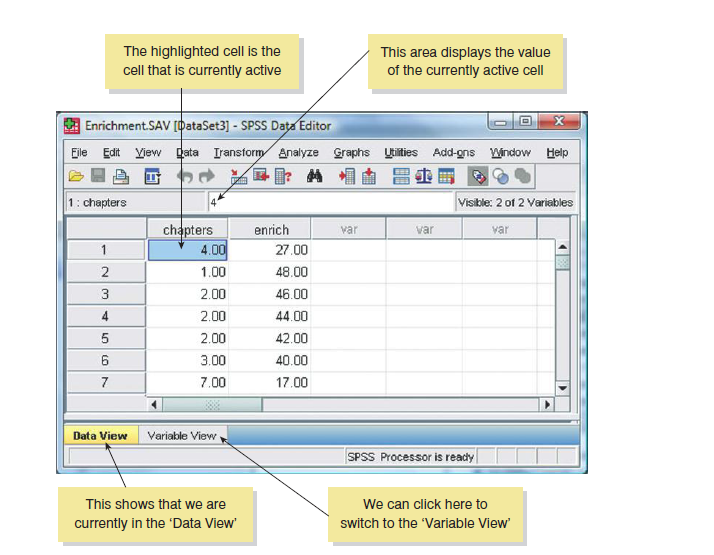
The SPSS Environment
SPSS mainly uses two windows: the data editor (this is where you input your data and carry out statistical functions) and the viewer (this is where the results of any analysis appear). There are several additional windows that can be activated such as the SPSS Syntax Editor, which allows you to enter SPSS commands manually (rather than using the window-based menus). For many people, the syntax window is redundant because you can carry out most analyses by clicking merrily with your mouse.
Once SPSS has been activated, a start-up window will appear, which allows you to select various options. If you already have a data file on disk that you would like to open then select Open an existing data source.
Functions of the various features in SPSS
File: This menu allows you to do general things such as saving data, graphs or output. Likewise, you can open previously saved files and print graphs data or output. In essence, it contains all of the options that are customarily found in File menus.
Transform: For example, you can use recode to change the values of certain variables (e.g. if you wanted to adopt a slightly different coding scheme for some reason). The compute function is also useful for transforming data (e.g. you can create a new variable that is the average of two existing variables). This function allows you to carry out any number of calculations on your variables.
Analyze: The fun begins here, because the statistical procedures lurk in this menu. This feature houses majority of the statistical tests in SPSS.
Defining Your Hypothesis in SPSS
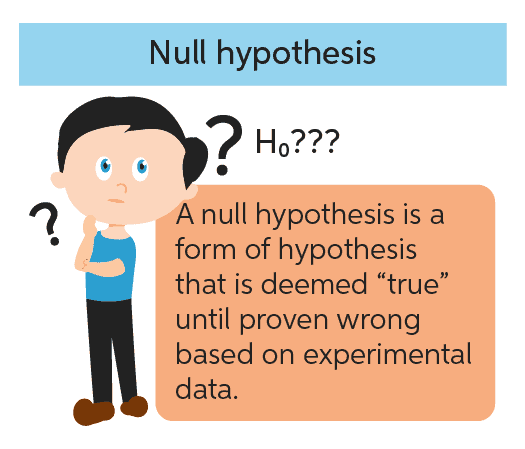
Scientific statements, as we have seen, can be split into testable hypotheses. The hypothesis or prediction that comes from your theory is usually saying that an effect will be present. This hypothesis is called the alternative hypothesis and is denoted by H1. (It is sometimes also called the experimental hypothesis but because this term relates to a specific type of methodology it’s probably best to use ‘alternative hypothesis’.) There is another type of hypothesis, though, and this is called the null hypothesis and is denoted by H0. This hypothesis is the opposite of the alternative hypothesis and so would usually state that an effect is absent.
Taking our Productivity example that we might generate the following hypotheses:
Alternative hypothesis: Men will score higher on productivity questionnaires than women.
Null hypothesis: Men will not score higher than women with respect to productivity.
Why You Should Learn SPSS Advanced Analytics From Port Harcourt Data School
- Gives accurate expression about quantitative method of analysis
- An understanding of advanced analytics whose basis is fundamental statistics
- Helps to define various statistical models for generating acceptance or rejection range.